Round Trip SMTP Reports
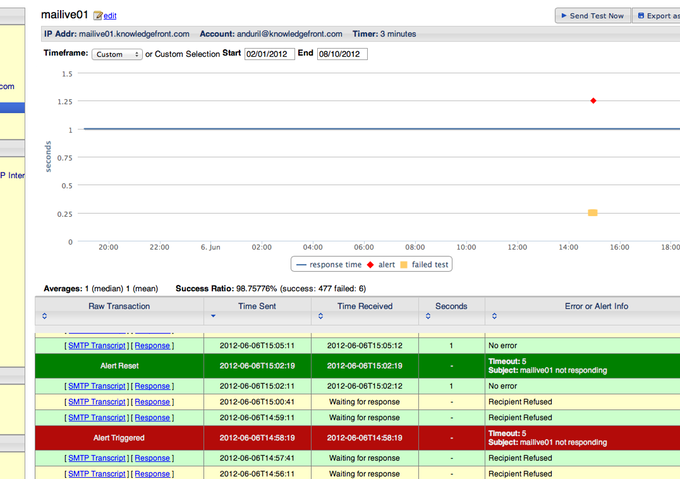
The report displays a graph of the times taken to complete the test as well as a table containing the individual results of each test including the SMTP Transcript and the full text of the Response with some analysis of the e-mail’s headers.
Alerts appear as a red diamond and Failures are yellow squares as shown below. The results and details of each test are shown a table below the graph including alert down and up designators.
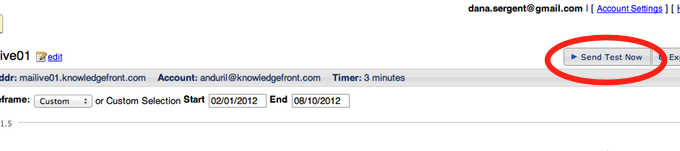
To trigger a test immediately click the Send Test Now button. The system will initiate a test and refresh the screen.
Exporting the current report's raw data as comma separated values text is as easy as clicking the Export as CSV button. The columns from the resulting file are:
- Type
- The type of data - Transaction or Alert
- Time Start
- Time the test or alert period started
- Time End
- Time the test or alert period ended
- Duration
- The total time in seconds of the round trip test or alert period
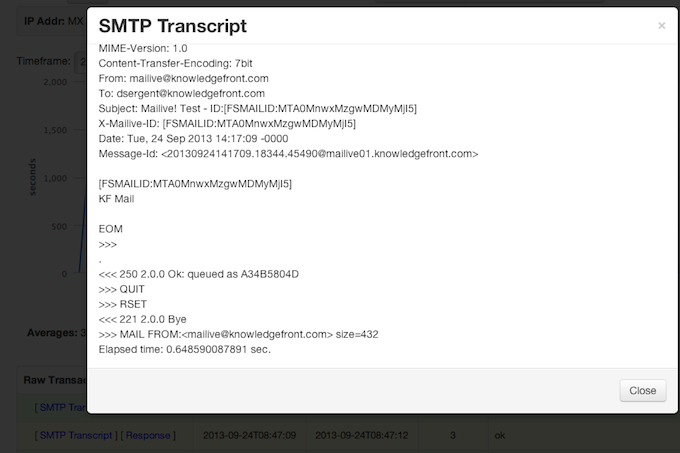
Clicking the [ SMTP Transcript ] link on the line corresponding to any test will bring up a dialog displaying the session as it occurred.
Lines beginning with <<< is the output from the server accepting the test. Lines starting with >>> is the output from Knowledge Front's system.
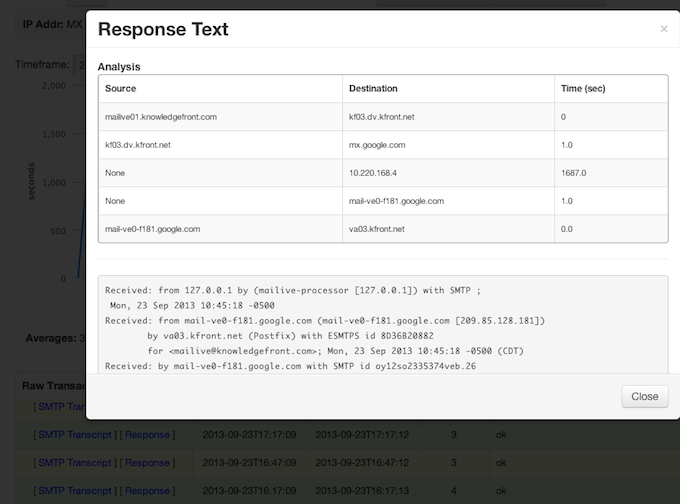
Clicking the [ Response ] link on the line corresponding to any
test will bring up a dialog that displays the exact e-mail as it was
sent back to the test system. See smtp_setup{.interpreted-text
role=“ref”} for help on setting up the automated response.
The top of the resulting dialog contains an analysis of the headers showing the time taken to transfer from one system to the next. This analysis is done by inspecting the time stamps located in the headers. Times need to be synchronized on all servers to get accurate information.
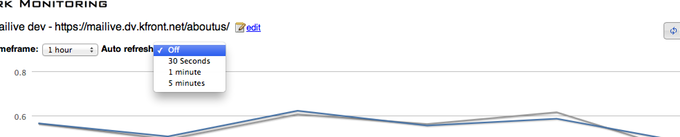
When troubleshooting issues or just keeping an eye on things it can be helpful to use the Auto Refresh feature in the report. Select the refresh rate (30 seconds to 3 minutes) and the report will fetch new data automatically
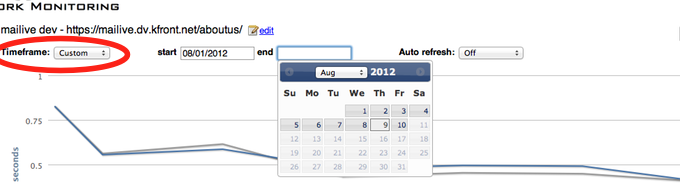
Quick selections are great for immediate issues, but what about viewing longer term trends? No problem. The last item of the Time frame select box is Custom which will display a date picker for selecting the date range.
In order to view large amounts of data on a single screen it is necessary to display averages of data. Calculating the averages ahead of time also speeds the generation of reports for users.
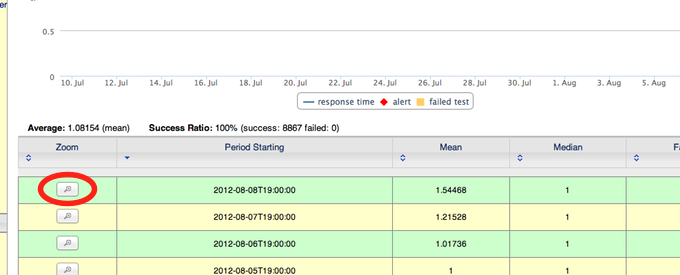
Reports showing more than 3 days worth of data will display hourly averages with the option to zoom in on any particular hour see below
When more than 14 days worth of data are selected the system will display daily averages.This makes it easy and possible to show years of data in little time.
When viewing averaged data there is a Zoom button available which will show the details of the selected hour or day.